Seyed Masoud Hosseini · Overview · Study log · Weekly summaries · Ideas · Search · Transcript · RSS feed
Financial Markets · Lecture 2 of 23 · 1:09:44
Lecture 2: Risk and Financial Crises
Study guide
What this lecture covers
This lecture answers a question central to the rest of the course: how do financial theorists use probability to understand risk, and why did that framework struggle to explain the 2007-2008 crisis? Rather than treating the crisis as a single historical narrative, Shiller reframes it as the accumulation of many small shocks governed by probability laws, then shows where the standard assumptions behind those laws broke down.
After watching, you'll be able to define return, expected value, variance, covariance, and correlation for financial data, explain why independence between risks matters for diversification and insurance, and describe two specific ways the crisis violated common assumptions: the failure of independence and the presence of fat-tailed (rather than normal) distributions of returns.
Key ideas
- Return and gross return: return is the capital gain plus dividend divided by starting price; gross return (1 plus the return) is always non-negative because losses are capped at 100% under limited liability.
- Arithmetic vs. geometric mean: the geometric mean of gross returns better evaluates investment performance because a single year of minus 100% return collapses it to zero, penalizing catastrophic losses in a way the arithmetic mean does not.
- Variance and covariance: variance measures the average squared deviation from the mean; covariance measures whether two variables move together, and is scaled into correlation, which ranges from minus 1 to plus 1.
- The law of large numbers: if risks are independent and identically distributed, the variance of their average shrinks toward zero as the number of risks grows, which is the mathematical basis for diversification and insurance.
- Value at Risk and its failure: after the 1987 crash, firms began computing Value at Risk (a probability of losing a given amount), but these calculations implicitly assumed independence that broke down during the 2007-2008 crisis, understating true risk.
- Systematic vs. idiosyncratic risk: a stock's return can be decomposed into a market-driven component (measured by beta from a regression against a market index) and an idiosyncratic component specific to that company.
- Fat-tailed distributions: unlike the normal distribution, financial returns show extreme outliers, such as the 1987 stock market crash, far more often than the normal distribution would predict, a pattern studied by mathematician Benoit Mandelbrot.
Walkthrough
The crisis as narrative versus probability (0:00)
Shiller contrasts the familiar historical narrative of the 2007-2008 crisis (bubbles, institutional collapses, bailouts, rebound) with a probability-based view that treats the crisis as an accumulation of many small shocks, setting up the lecture's focus on independence and fat tails.
Return and central tendency (9:15)
He defines return and gross return, then introduces expected value, the sample mean, and the geometric mean, explaining why the geometric mean is a stricter and more appropriate way to evaluate an investor who has had one catastrophic year.
Variance, covariance, and correlation (19:26)
Shiller defines variance and standard deviation as measures of variability, then covariance and correlation as measures of how two random variables move together, laying the groundwork for the independence discussion that follows.
Independence, the law of large numbers, and Value at Risk (26:54)
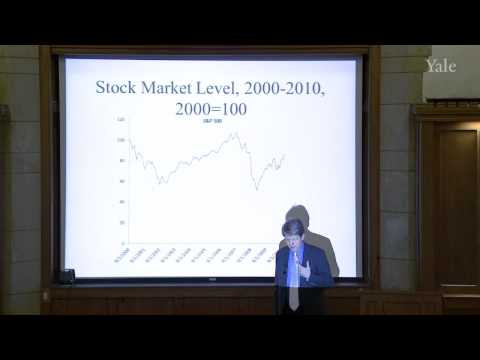
Using a plot of the stock market from 2000 to 2010, he explains the law of large numbers and how firms used Value at Risk models after 1987 that assumed relative independence among risks, an assumption that proved too optimistic during the crisis. He also introduces CoVaR as a newer measure meant to capture episodes when correlations spike.
Apple as a case study in systematic and idiosyncratic risk (39:15)
Using Apple's stock price from 2000 to 2010, Shiller shows how a scatter plot of Apple's monthly returns against S&P 500 returns yields a regression line with a beta of 1.45, illustrating how a stock's return splits into a market-driven component and a large idiosyncratic component, illustrated by episodes such as rumors about Steve Jobs' health and the Lehman Brothers collapse.
Fat-tailed distributions and historical outliers (58:59)
He introduces the normal distribution and contrasts it with fat-tailed distributions studied by Benoit Mandelbrot, then shows a histogram of daily S&P returns since 1928 containing extreme moves, such as the October 1987 crash, that would be effectively impossible under a normal distribution but occur with some regularity in practice.
Before you watch
- No prior probability or statistics course is required; the lecture reviews the necessary concepts from scratch.
- It helps to have watched Lecture 1 for context on the course's overall approach and the 2007-2008 crisis it repeatedly returns to.
Check your understanding
- Why does Shiller recommend the geometric mean over the arithmetic mean for evaluating an investment manager's track record?
- What does it mean for the law of large numbers to "break down," and why did that matter during the 2007-2008 crisis?
- How does the beta from Apple's regression against the S&P 500 separate systematic risk from idiosyncratic risk?
- Why does a normal distribution understate the probability of extreme events like the October 1987 crash, and what alternative did Mandelbrot propose?
Vocabulary
- probability (noun)
- A measure of how likely something is to happen.
Financial theorists use probability to model risk. - variance (noun)
- A measure of how spread out a set of values is around their average.
Variance shows how much a stock's returns bounce around. - covariance (noun)
- A measure of whether two things tend to move together or in opposite directions.
Covariance shows if two stocks rise and fall at the same time. - correlation (noun)
- A number between -1 and 1 showing how closely two things move together.
High correlation means two assets move almost the same way. - fat-tailed distribution (phrase)
- A pattern of outcomes where extreme events happen more often than a normal bell curve predicts.
Stock returns often follow a fat-tailed distribution. - return (noun)
- The gain or loss made on an investment, usually shown as a percentage.
The return on a stock includes its price gain plus dividends. - dividend (noun)
- A payment a company makes to its shareholders from its profits.
Return equals capital gain plus dividend, divided by starting price. - limited liability (phrase)
- A rule that investors can lose no more than what they invested in a company.
Limited liability caps losses so gross return can't go negative. - arithmetic mean (phrase)
- The simple average found by adding numbers and dividing by how many there are.
The arithmetic mean can overstate performance after a big loss. - geometric mean (phrase)
- An average that accounts for compounding, better suited to investment returns over time.
The geometric mean better reflects a catastrophic loss year. - law of large numbers (phrase)
- The principle that averaging many independent random events makes the result more predictable.
The law of large numbers is the basis for insurance and diversification. - diversification (noun)
- Spreading investments across different assets to reduce overall risk.
Diversification relies on the law of large numbers. - systematic risk (phrase)
- Risk that affects the whole market and cannot be removed by diversification.
Systematic risk is measured through a stock's beta. - idiosyncratic risk (phrase)
- Risk specific to one company or asset, not shared by the whole market.
Apple's stock has a large idiosyncratic risk component. - beta (noun)
- A number showing how much a stock's price tends to move relative to the overall market.
Apple's beta of 1.45 shows it moves more than the market. - regression (noun)
- A statistical method for finding the relationship between two variables.
A regression against the S&P 500 gives Apple's beta. - outlier (noun)
- A data point far from most other values, showing an extreme event.
The 1987 crash is a major outlier in stock market history. - bailout (noun)
- Emergency financial help given to prevent a company or system from collapsing.
The 2007-2008 crisis led to major government bailouts. - accumulation (noun)
- The gradual gathering or buildup of something over time.
The crisis can be seen as an accumulation of many small shocks. - shock (economic) (noun)
- A sudden, unexpected event that disrupts an economy or market.
Many small shocks combined to create the larger crisis.
Chapters
- 0:00 Chapter 1. Financial Crisis of 2007-2008 and Its Connection to Probability Theory
- 5:51 Chapter 2. Introduction to Probability Theory
- 9:58 Chapter 3. Financial Return and Basic Statistical Concepts
- 26:29 Chapter 4. Independence and Failure of Independence as a Cause for Financial Crises
- 38:58 Chapter 5. Regression Analysis, Systematic vs. Idiosyncratic Risk
- 58:59 Chapter 6. Fat-Tailed Distributions and their Role during Financial Crises
From the YouTube description
Financial Markets (2011) (ECON 252)
Professor Shiller introduces basic concepts from probability theory and embeds these concepts into the concrete context of financial crises, with examples from the financial crisis from 2007-2008. Subsequent to a historical narrative of the financial crisis from 2007-2008, he turns to the definition of the expected value and the variance of a random variable, as well as the covariance and the correlation of two random variables. The concept of independence leads to the law of large numbers, but financial crises show that the assumption of independence can be deceiving, in particular through its impact on the computation of Value at Risk measures. Moreover, he covers regression analysis for financial returns, which leads to the decomposition of a financial asset's risk into idiosyncratic and systematic risk. Professor Shiller concludes by talking about the prominent assumption that random shocks to the financial economy are normally distributed. Historical stock market patterns, specifically during crises times, establish that outliers occur too frequently to be compatible with the normal distribution.
00:00 - Chapter 1. Financial Crisis of 2007-2008 and Its Connection to Probability Theory
05:51 - Chapter 2. Introduction to Probability Theory
09:58 - Chapter 3. Financial Return and Basic Statistical Concepts
26:29 - Chapter 4. Independence and Failure of Independence as a Cause for Financial Crises
38:58 - Chapter 5. Regression Analysis, Systematic vs. Idiosyncratic Risk
58:59 - Chapter 6. Fat-Tailed Distributions and their Role during Financial Crises
This course was recorded in Spring 2011.
← Lecture 1: Introduction and What this Course Will Do for You · Lecture 3: Technology and Invention in Finance →